The Misunderstood U.S. Office Market
High vacancy rates in the U.S. office market are misunderstood—while demand has partially diminished, the growing issue is with excess supply of dated, functionally obsolete office buildings and an undersupply of the highest quality offices.
Executive Summary
- High vacancy rates in the U.S. office market are misunderstood—while demand has partially diminished in the aftermath of the COVID pandemic and new behavior set by working from home, the growing issue is with supply. There is an excess of dated, functionally obsolete office buildings and an undersupply of offices that satisfy tenants’ changing needs.
- Why now? The office market has been impacted by several converging factors: the pandemic accelerated the adoption of technologies that change the way we utilize offices and their core function, tenant preferences have shifted to buildings with modern amenities and functionality, and the recent rise in interest rates has exposed older office buildings as uneconomical.
- As a result, there will be a wide distribution of outcomes for owners, lenders, and local communities as a portion of the U.S. office market will need to be renovated or repurposed.
Introduction
Vacancy rates in the United States’ office market have dominated headlines since 2020 and the aftermath of the COVID pandemic. With the implementation of flexible and work-from-home policies, many attribute the weak occupancy rates in the market to diminished tenant demand. But we believe the real issue facing the sector is one of oversupply: dated, functionally obsolete office space is plentiful while office buildings that can meet modern tenant preferences are limited.
The current state of the market is one that has been decades in the making. It has come to a head in recent months due to the convergence of several factors, including the acceleration of technology’s impact on how we interact with the built world, tenant preference for modern buildings constructed with relevant amenity packages, and the recent rapid rise in interest rates that has exposed commoditized office buildings as being economically unviable.
The result we see is a stark bifurcation in the market where 90% of all U.S. office vacancies are contained in the bottom 30% of buildings, largely characterized by older offices with limited amenities and reduced functionality.1 By contrast, the top quartile of office buildings are experiencing record-high rents and stable vacancy rates. We believe this growing divide will only widen as legacy leases expire and tenants look for new space that reflects evolving business culture to engage employees and meet sustainability goals.
To resolve the vacancy issues plaguing office real estate, we believe a large portion of these older office buildings will need to be repositioned, repurposed or demolished. Against this backdrop, we will examine how the current situation in the U.S. office market is not due to a permanent decrease in demand, but instead a mismatch of supply.
State of the U.S. Office Market Today
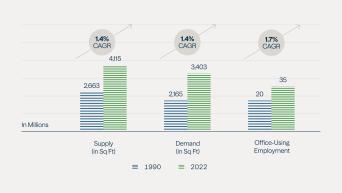
When measured by the three most historically significant metrics—supply, demand and headcount—the U.S. office market would have been considered to be “in balance” and the expectation was that it would return to normal following the shock brought on by the pandemic.
Figure 1: Office Supply and Demand Growth
Source: CBRE-EA , U.S. Bureau of Labor Statistics.
Office supply has traditionally grown in lockstep with demand (as measured by leased square feet), with office-using employment (headcount) outpacing both. As applied to any other industry, this would be considered a healthy phenomenon, but these statistics reflect the past in all respects, most notably, how office space was utilized by tenants.
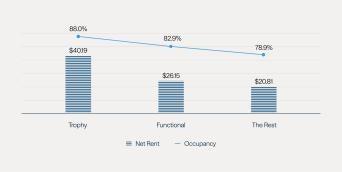
During this same time period of 1990 to 2022, businesses have digitized critical functions that required large and dedicated portions of office buildings, including mail rooms, copy centers, file storage, libraries, and conferencing centers. While businesses can live without the analogue, they can’t function today without email, high-speed internet or video conferencing. That means what made an office building work in the past, is not as relevant today. As a result, the U.S. office market can be divided into three general categories: trophy, functional, and the rest.
Figure 2: Current U.S. Office Performance
Source: JLL as of Q4 2023.
There are approximately 500 Trophy office buildings in America with a total of 238 million square feet, representing about 9% of the market.2 This category generally consists of buildings constructed in the mid-2010s or later. Older buildings that have received significant redevelopment can also effectively compete in the Trophy category but require a significant amount of capital for upgrades to meet the demands of their tenants.
The Trophy category is distinguished by the following attributes:
- Centrally located, close to multiple forms of transportation and often situated in live-work-play communities
- Contain a dense amenity package, including access to fitness and conference centers, communal meeting areas, a multitude of food and beverage options, which can include proximity to a rich selection of neighborhood amenities, and outdoor space
- Modern building design providing tenants with great light and air, flexible build-out schemes, and a welcoming lobby experience
- Sustainable and energy-efficient building systems that utilize clean energy
The Functional category serves a key constituency in the market. Their physical attributes overlap with that of the Trophy office buildings but lack one or more attributes that in turn limit rent and occupancy. While there is not one common attribute that prevents these buildings from competing with the best buildings, location and age of building are the best predictors. For example, the best performing New York City office properties are newly constructed with minimal columns allowing for flexible floorplate design, are located near transportation and entertainment hubs, and are highly amenitized. These buildings are designed to cater to New York’s tenant base, which is larger on average, due in part to the concentration of global headquarters, notably 43 of the Fortune 500 companies.
The final category is comprised of older, commoditized buildings that were developed prior to the adoption of modern technology. These buildings are characterized by large columns throughout the floor, lack of natural light, low ceiling height, clunky mechanical systems taking up floor space and large interior space. Technological advancements have reduced the overall space required by tenants at commodity locations as mailrooms and filing cabinets are replaced by emails and cloud storage. This change is expected to accelerate as technology evolves. We will explore this topic further later on.
Where did U.S. Office Oversupply Come From?
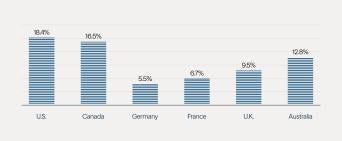
The U.S. has been disproportionately impacted by office vacancies in the aftermath of the pandemic. The vacancy rates in the U.S. exceeds those of other developed economies.
Figure 3: Global Office Vacancy
Source: CBRE, JLL, Cushman & Wakefield as of 2023.
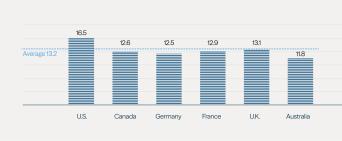
There is no agreed upon universal metric for measuring the amount of office space needed in any given market. But with the adoption of modern technology, it is generally accepted that fewer square feet of office space are needed by today’s corporations than in the past. The level of excess office inventory in the U.S. relative to the rest of the world is particularly pronounced when measured on a per capita basis.
Figure 4: Office Space Per Capita
Source: CBRE, JLL, Cushman & Wakefield, CoStar as of 2023.
The U.S. office market has the highest ratio of office space per capita in the world, most of which was built for a world that no longer exists. Even worse, the average office building in the U.S. is more than 50 years old.3
How the Pandemic Impacted Demand for U.S. Office Space
The pandemic accelerated the adoption of modern technology for companies and laid bare the shift in the utility of office space. Offices have become critical for companies to innovate and collaborate rather than just exist as hubs for executing routine tasks. As technology continues to evolve, so will the demands of companies on their office spaces.
Figure 5: Evolution of Office Utilization
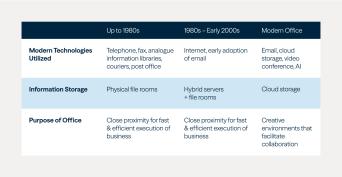
The 1980s and 1990s started the rise of modern technology, including the early adoption of email and the internet, and a meaningful globalization of the workforce. But it was not until the 2000s that the impact of technology would be fully realized—ubiquitous email (including access via smart-phones), cloud storage, and video conferencing lowered many of the barriers to a more flexible workforce. Over time, the net result has been a reduction in the amount of physical space required, and an increased desire for collaborative meeting space—more break-out rooms, conference centers, and the rise of the open floor plan. But these shifts were slow and modest, aided by long-term leases and real estate departments unable or unwilling to challenge the status quo. That is, until March 2020.
Early 2020 was defined by the work-from-home phenomenon. Management and employees were forced to find new ways of working in an environment where even a brief in-person meeting ran the risk of an outbreak of the pandemic. It was in this environment that technology was tested and saw relative success. Meetings were moved to the cloud, Slack replaced interoffice interactions, and happy hours turned virtual. However, what started initially as a stopgap solution to a global pandemic became a more permanent way of working for large corporations—this was particularly true for technology companies.
The shift disproportionally affected the U.S. because of its excess supply. Firms like Morgan Stanley, Meta, Disney, Fox, KPMG, and Amazon all implemented meaningful work-from-home policies in the U.S.. Compared to Europe and Asia, the U.S. had the highest work-from-home rate of all regions, peaking at 37%.4 As the post-pandemic world presses on, office vacancies continue to rise and are now at, or near, all-time highs across major U.S. markets. While many companies desire to get employees back in the office, a full return won’t bridge the demand gap.
Employees returning to the office found it wasn’t the same office they left and expect more after years of work-from-home. U.S. companies are increasingly looking for higher-quality office space, which, in turn, exposes the oversupply issue confronting older, less attractive office space in the market. The pandemic laid bare the reality that technology has changed the way we use offices and are increasingly becoming a meeting place for employees to create, collaborate and innovate. The modern office is no longer a space to store paper files, host server rooms or house some of the administrative functions it would have done in the past.
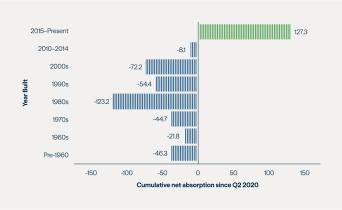
Figure 6: Net Absorption by Building Vintage (Million Sq Ft)
Source: JLL as of Q4 2023.
The result is a real estate market where the highest quality, best located buildings are highly undersupplied, while the commoditized counterparts are oversupplied. Assets built since 2015 continue to attract significant demand and have seen 127 million square feet of net absorption since the onset of the pandemic, while offices built prior to the 1990s have seen 236 million square feet of negative net absorption.5 Meanwhile, demand for trophy office space has remained solid. Office space represents less than 5% of general and administrative expenses for corporations, and occupancy costs as a percentage of revenue has effectively been cut in half over the past three decades.6
Case Study
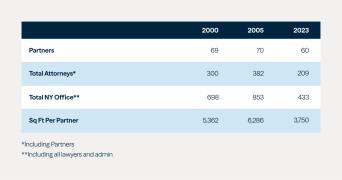
A law firm in the 1980s required substantially more space in order to accommodate stenographers, law libraries, mailrooms and storage space for files. Many of these related support services have been rendered obsolete in the modern day due to technological innovation and less headcount is needed to run a successful business.
By way of example, one Brookfield tenant, a prominent New York City law firm, has seen the number of partners it employs decline by roughly 13% between 2000 and 2023. During the same period, the total number of lawyers and support staff dropped by nearly 37%. Meanwhile, the total revenue for the firm increased more than 200% over the same period.7 This is not unique to the legal profession. Other sectors, ranging from architecture to media and telecommunications business, are doing more with less office space because of technological advancements.
Source: a NYC law firm.
Flight to Quality is the Future of the U.S. Office
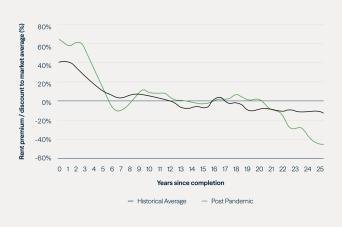
Prior to rising interest rates and the outbreak of the pandemic, there was already a clear trend of companies gravitating to higher-quality office buildings with modern amenities. This shift saw rents in newer or renovated buildings begin to climb along with their profitability.
Figure 7: Rent Premiums for New Construction are Widening, as are Rent Discounts for Older Age
Source: JLL as of Q4 2023.
The phenomenon is not unique to the U.S.. Cities like London, Shanghai, Paris and Hong Kong have also seen a similar shift. In the U.S., vacant space in Trophy and other top tier buildings has declined by 5% since 2019, while new buildings are achieving nearly a 60% rental premium (versus 40% historically) and are hitting all-time highs.
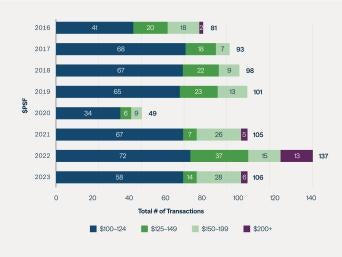
Figure 8: Tenants Are Undeterred By Price
$100+ Per-Square-Foot Transactions in NYC, 2016–2023
Source: CBRE Research.
New York has witnessed more leases signed at $200 per square foot or more since 2020 than the previous five years combined. This is largely due to a lack of supply of new top-tier office space. By contrast, offices built in the 1980s and 1990s account for more than 50% of the new vacancies since 2020, despite accounting for less than 40% of the total office inventory.8
Poor fundamentals and limited capital are expected to cause drag on new developments, meaning the future supply of new office buildings is expected to be below the long-term average. The projected supply growth of 80 basis points is roughly half the historical average and could be even lower given the practical limitations on new construction.
As we note earlier in this paper, tenants need less space than before to operate and have employees that are demanding more from their office experience. With limited new and or renovated space available going forward, and continued expiries of legacy leases, we expect this trend to continue.
A Call to Action
The rapid change in the U.S. office market is also creating headaches for local municipalities that are still charging property taxes on buildings based on legacy values.
Some municipalities, including those in places like New York, Boston, Toronto and Calgary, have recognized the looming issue and have taken initial steps to implement programs to incentivize the redevelopment of underutilized office space into residential buildings to fit their housing needs.
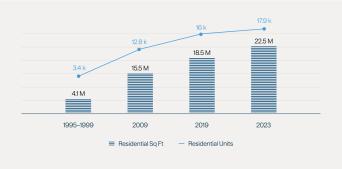
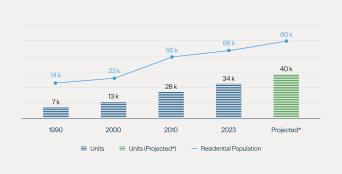
It is not a concept that is entirely new. Perhaps the most high-profile example is New York’s Financial District. The amount of office inventory has declined by 20 million square feet on a net basis since 1990 as major banks, like J.P. Morgan, and major corporations, like Dow Jones, vacated the area south of Canal Street for elsewhere in the city.9 At the same time, the residential population has increased almost fivefold to 66,000 over the same period supplementing the lost property taxes and generating significant business activity to support the population growth.
Figure 9: Lower Manhattan Office to Residential
Source: Alliance for Downtown New York.
The demographic shift was spurred, in part, by the 2002 Liberty Bond Program in New York City. The program, which incentivized the redevelopment of the Financial District neighborhood after the 9/11 attacks, resulted in the conversion of empty office buildings into residential units and the construction of new residential towers. Since 1995, over 19.7 million square feet of Lower Manhattan office space has been converted from office space to residential or hotel use, totaling 16,700 residential units.10 The Financial District is now better known as a residential neighborhood than it is for its office towers.
Figure 10: Lower Manhattan Residential Statistics
*Projected total includes buildings under construction and planned for development.
Source: Alliance for Downtown New York.
However, not all these older buildings need to be converted to residential space. Many—especially in major urban centers—can be repositioned as companies look for high-quality office spaces in cities with limited land for new developments.
Conclusion
Issues facing the U.S. office sector have been bubbling up for decades but were accelerated with the onset of the pandemic. The increased digitization of the workplace and subsequent work-from-home policies have exacerbated the situation, but the fallout has been mostly contained to the lower end of the market.
The same cannot be said for the top end of the market. Brookfield has been positioning itself to take advantage of this flight to quality. Roughly 95% of Brookfield’s U.S. office assets are either new build or best-in-class stock, like Manhattan West, Brookfield Place and 660 Fifth Ave. Brookfield’s core portfolio of office properties has been outperforming the broader market, especially in the gateway cities, and rents are expected to continue to grow with stronger projected demand outstripping new supply.
Two Manhattan West, for example, is going to achieve a 35% premium on rents versus its sister building, One Manhattan West, which was built just five years ago and leased prior to the pandemic. At the same time, Brookfield’s core portfolio of top-tier office space saw a 5% net operating income growth year over year.
While the top end of the market continues to benefit from flight to quality, the oversupply issue facing older, commoditized buildings will need collaboration to resolve. But from this will be significant opportunities.
Endnotes:
- JLL
- CBRE
- CBRE IM Global Office Report
- U.S. Census Data
- JLL U.S. Office Outlook Q3 2023
- Eastdil Secured
- Law.com
- CompStak
- CoStar
- Alliance For Downtown New York
Disclosures
This commentary and the information contained herein are for educational and informational purposes only and do not constitute, and should not be construed as, an offer to sell, or a solicitation of an offer to buy, any securities or related financial instruments. This commentary discusses broad market, industry or sector trends, or other general economic or market conditions. It is not intended to provide an overview of the terms applicable to any products sponsored by Brookfield Asset Management Ltd. and its affiliates (together, "Brookfield").
This commentary contains information and views as of the date indicated and such information and views are subject to change without notice. Certain of the information provided herein has been prepared based on Brookfield's internal research and certain information is based on various assumptions made by Brookfield, any of which may prove to be incorrect. Brookfield may have not verified (and disclaims any obligation to verify) the accuracy or completeness of any information included herein including information that has been provided by third parties and you cannot rely on Brookfield as having verified such information. The information provided herein reflects Brookfield's perspectives and beliefs.
Investors should consult with their advisors prior to making an investment in any fund or program, including a Brookfield-sponsored fund or program.


